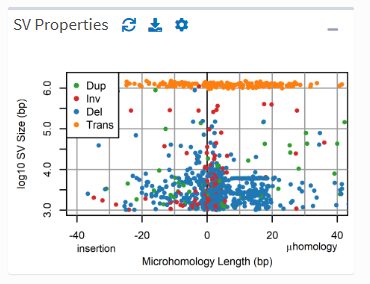
staticPlotBox
The staticPlotBox plot widget displays non-interactive plots that are optimized for generating publication-ready images. It allows users to explore display properties like plot size, point size, and legend placement, in order to create predictable image files.

On screen, plots fill a single shinydashboard box(). The on-screen scale can therefore be bigger or smaller than the final reproduction size, but plots are nearly always legible and usable for data exploration.
A link allows for immediate download of the rendered plot, with no guessing as to what it will look like in the png file.
The drawback is that plots are not interactive. If this is important for your app, try mdiInteractivePlot or the interactivePlots family of widgets. Be aware that staticPlotBox is an easier interface to master as compared to interactivePlots.
staticPlotBox is a typical widget module with standard UI and Server functions, described below. At present, the module draws plots using R base graphics (future enhancements will support ggplot, although it is less of a gain given how the module works).
staticPlotBoxUI options
The staticPlotBoxUI function takes the following arguments in addition to ‘id’:
# staticPlotBox_ui.R
staticPlotBoxUI <- function(
    id,
    title,
    ...,
    documentation = serverEnv$IS_DEVELOPER,
    code = serverEnv$IS_DEVELOPER,
    console = serverEnv$IS_DEVELOPER,
    terminal = FALSE
)
where:
- title = the title of the plot box
- … = additional arguments passed to shinydashboard::box()
- all other arguments are passed to mdiHeaderLinks()
staticPlotBoxServer options
The staticPlotBoxServer function takes the following arguments in addition to ‘id’:
# staticPlotBox_server.R
staticPlotBoxServer <- function(
    id,
    #----------------------------
    create = function() NULL,
    maxHeight = "400px",
    points  = FALSE,
    lines   = FALSE,
    legend  = FALSE,
    margins = FALSE,
    title   = FALSE,
    #----------------------------
    url = getDocumentationUrl(
        "shiny/shared/session/modules/widgets/plots/staticPlotBox/README",
        framework = TRUE
    ),
    baseDirs = NULL,
    envir = parent.frame(),
    dir = NULL,
    settings = NULL,
    template = settings, # for legacy support
    ...
)
where:
- create = a function or reactive that creates the plot (see below)
- maxHeight = how tall the box is allowed to get
- points = if TRUE, expose settings appropriate to plots that have points
- lines = if TRUE, expose settings appropriate to plots that have lines
- legend = if TRUE, expose settings appropriate to plots that have legends
- margins = if TRUE, expose settings that allow users to adjust plot margins (i.e., mar)
- title = if TRUE, expose settings that allow users to set the plot title
- url to settings = arguments passed to activateMdiHeaderLinks()
- … = additional arguments passed to settingsServer
staticPlotBoxServer return value
The module returns a list as follows:
# staticPlotBox_server.R
list(
    settings        = settings,
    get             = settings$get,
    initializeFrame = initializeFrame,
    addPoints       = addPoints,
    addLines        = addLines,
    addBoth         = addBoth,
    addArea         = addArea,
    addLegend       = addLegend,
    addMarginLegend = addMarginLegend
)
where settings and get are the same as returned by settingsServer. The remaining elements are helper functions to fill the plot according to the user’s current settings (see below).
Using the widget
First, place an instance of the staticPlotBox widget in your UI (only widget-related code is shown):
# <scriptName>_ui.R
staticPlotBoxUI(
    ns('id')
    # ...
)
Then activate the plot in the matching server and define the function that will fill (i.e., create) the plot:
# <scriptName>_server.R
myPlot <- staticPlotBoxServer(
    'id',
    points = TRUE,
    lines = TRUE
    legend = TRUE,
    # etc.
    create = function(){
        # use myPlot$settings/get() as needed
        # do any preparative work, e.g.:
        d <- myReactive()
        myPlot$initializeFrame(...)
        myPlot$addPoints( # addLines follows the same pattern, etc.
            x = d$xValue,
            y = d$yValue,
            ...
        )
        abline(v = 0) # an example of direct plot manipulation
        addLegend(
            legend = character(),
            col = c()
        )
    }
)
The call to staticPlotBoxServer returns the list of settings and helpers, which is then used by the create function to initialize and fill the plot.
Notice that you do not have to call plot() or png() to initialize the plot - initializeFrame() does that for you. Your function then just needs to add the plot contents.
As shown, you can modify the plot using any functions from R base graphics, but we recommend adding points, lines, and legends using the helper functions as they will properly obey user settings.
Helpers are all defined with the ... argument to allow you to pass additional arguments to the corresponding graphics functions (points, lines, legend), e.g.:
# <scriptName>_server.R
myPlot <- staticPlotBoxServer(
    create = function(){
        # ...
        myPlot$addPoints(
            x = d$xValue,
            y = d$yValue,
            col = CONSTANTS$plotlyColors$blue # passed to points()
        )
    }
)
The last example shows how to access the same colors as plotly if you would like to match the appearance between staticPlotBox and interactivePlot panels.
Additional references
For more detailed views of the module’s code, see:
For a complete working example, see: